Infrared Remote Recording Part 3
In the previous posts, we created an IR reader, then captured the data and stored it into memory. In this post, I will show you how to use an inexpensive logic analyzer to the Macintosh and look at the waveforms.
Logic Analyzer LHT00SU1
I tend to use the LHT00SU1 logic analyzer. It is a clone of the USBee Cwav device. (The creators of the device are out of business.) You can purchase it from Amazon. Recently, the only one I found to be a Prime eligible unit is here: LTH00SU1. The “Prime” unit is stocked in the U.S., and in this case is 40% higher than the lowest price on Amazon. (I am personally willing to pay more to get an approximately $50 device delivered sooner, and without the hassle of the mail system occasionally failing to deliver.)
There are cheaper analyzer alternatives that also work with PulseView, such as the HiLetgo Analyzer. (For more info, see the Post Intermission: Electrical Debugging Tips.)
Following is my setup with the breadboard and the logic analyzer. I used side by side pins on the breadboard to make it cleaner to bring the logic analyzer to the work. I then used single wires to route to the logic analyzer pins. This provided me with the cleanest looking board (for sitting a week at a time on my desk):
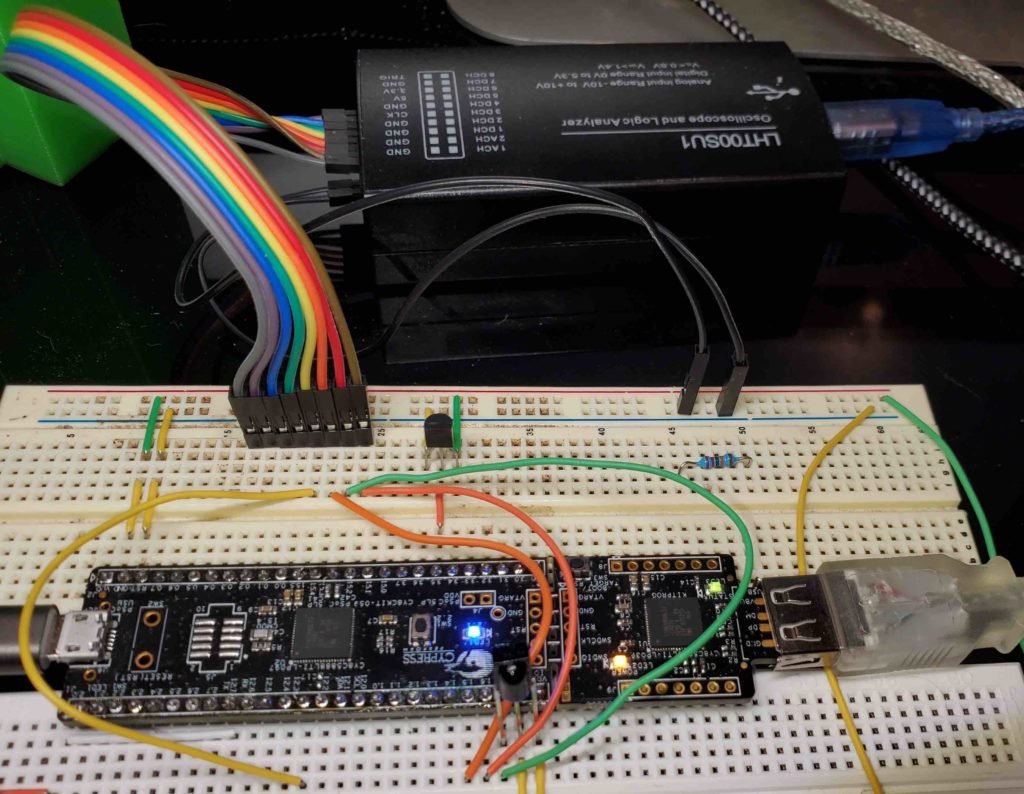
LHT001 Setup
PulseView: Interaction with VMWare and Mac
When using PulseView with the LHT00SU1, VMWare initially wants to grab the device and give it to Windows. It is listed as a “CWAV USB” device. If you wish to run the Windows PulseView, then you can simply run the PulseView program on that platform. (Note: The latest Nightly Build, as of June 20, 2020, of PulseView failed to run on Mac Sierra. You may wish to use the 0.42 release under Mac.)
If you wish to connect to your analyzer and run your application on the Mac, the easiest way is to bring up the VMware “USB and Bluetooth…” menu selection dialog, plug in the device, and locate the CWAV USB entry. Uncheck the box next to it (to disconnect it from Windows) and make the default action connect to mac, so it looks like the following:
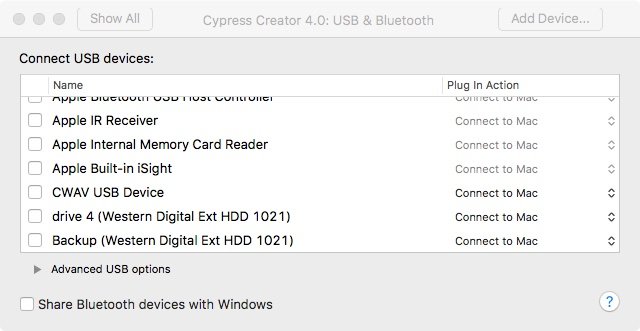
Once you have done that, and opened PulseView, the device still won’t be found. The reason is that PulseView somehow causes the USB device to be renamed to CWAV fx2lafw, which VMWare sees as a different device. Go to the USB & Bluetooth dialog and select the same options for the new CWAV device, as follows:

Now you can run PulseView and start to connect to it. In order to connect to the LHT00SU1, you must choose the correct driver, and then click on “Scan for Devices using driver above,” as follows. You start this process by clicking on the “<No Device>” button, which will bring up the following dialog. The HiLetGo device and the LHT00SU1 device both use the fx2 driver (which is a Cypress USB device):

Once you see the CWAV USBee AX with 9 channels, you can click OK and you should see D0-D7 and A0 show up in your PulseView window:

For our purposes, this is not ideal. 1 million samples at 20 kHz takes a long time. Also, with a 20 kHz sample rate, you will miss some waveform transitions. The slowest rate you should run is on the order of 5 mHz to 24 mHz.
On a Mid 2010 iMac running Sierra, and with 16GB of ram, the best rate you can hope to run reliably is 12 mHz. This is good enough for this project. You can go faster on a late 2012 iMac, Sierra, 16GB ram. I have noticed that 24 mHz is reliable.
The user interface for the PulseView is point and click. There are no “Menus” as such, every selection is through buttons. The D0-A0 indicators on the left of the screen are buttons along with all the other icons. It will take some time to get a feel for it. I clicked on the D0-D7 buttons and modified the text and selected one of them for a rising trigger on the Logic Analyzer. To learn more about using the LHT00SU1 Logic Analyzer from utube look here: https://youtu.be/KiDDL5xtnG0.
My PulseView setup follows, along with an initial capture of an IR event. Also note I chose a falling edge for the beginning of the capture from the IR input. I also chose to allow 10% pre-trigger capture ratio on the screwdriver/wrench button left of the red probe button.
(Note: I named the logic traces the same as the pin numbers in the project, by clicking on the D1 tab, etc, and changing the text in the button description. This helps during troubleshooting as you have less to remember when transitioning from waveforms on the screen to reading your code.)
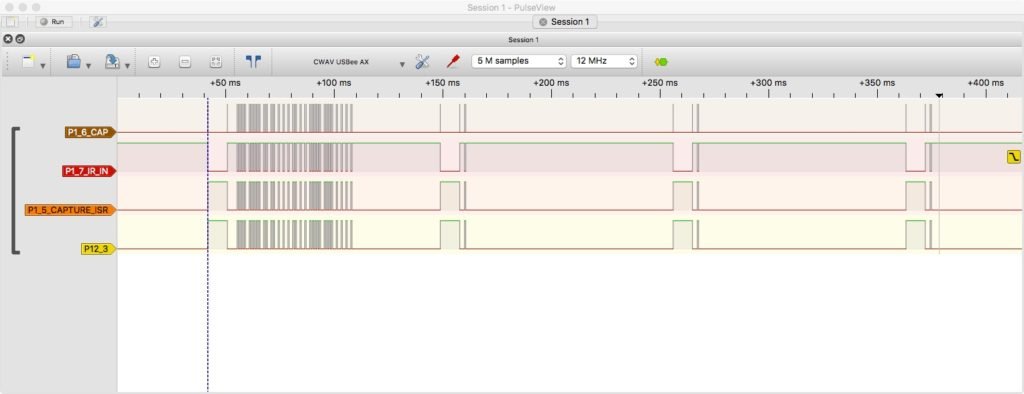
Clicking the Run button and then pressing and holding down the “up” key on the temperature button provided the trace shown. If you press and release quickly, you usually only see the “main” pulse train and one “repeat” train on the Frigidaire controller.
For Next Time
I used the logic analyzer to debug the hardware and get it operational. I also used it to determine when code was executed, by toggling the P1_5_CaptureIsr pin when I was in a routine. This technique is useful when debugging real time software, especially when combined with an analyzer. Knowing that your routine was entered after the proper edge occurred on an input is extremely valuable.
If things go well, next time we will look at playing the IR signal back. This is more involved, and involves more external hardware.
Enjoy!
About The Author
W Maxfield
Firmware/hardware Engineer for too many years.